
Logging is a critical aspect of modern application development and operations. It provides insights into the running state of applications, helps in diagnosing issues and supports monitoring and alerting. Effective logging can mean the difference between quickly resolving an issue and spending hours or days troubleshooting.
For containerized applications running in Docker, logging takes on additional importance. Containers are ephemeral, and logs are essential for understanding the behavior of an application before, during, and after an issue occurs. Moreover, structured logging in JSON format allows for easy integration with log management systems like Graylog, which can ingest, parse, and visualize logs efficiently.
From an audit and security perspective, logging is indispensable in NetDevOps, Docker and Python applications. Detailed logs enhance security monitoring by identifying suspicious activities, unauthorized access, and potential breaches. They ensure compliance with regulations by documenting access and data handling. In incidents, logs support forensics by providing insights into what happened, how it occurred, and how to prevent future issues. Additionally, logging ensures accountability by tracking user actions and system changes, promoting transparency and responsibility within the organization.
These are some good reasons why you should focus on logging in your NetDevOps environment….
There are several logging systems on the market, such as Splunk, Loki, Graylog, Kibana and many more, as well as more basic ones like syslog. In this example, I will demonstrate Graylog, as it is easy to set up and available as open-source software with basic features.
Install Graylog in docker for demo purposes#
Graylog provides Docker Compose files to easily set up a test environment.
mkdir graylog
cd graylog
wget https://raw.githubusercontent.com/Graylog2/docker-compose/main/open-core/docker-compose.yml -O docker-compose.yml
wget https://raw.githubusercontent.com/Graylog2/docker-compose/main/open-core/.env.example -O .env

# Modify .env file

# set GRAYLOG_PASSWORD_SECRET
pwgen -N 1 -s 96
IZyFjqKs4cxacTR8GKfZb02cNuUScLiiGAlcWmnVPaUWH3NjtQXTP0Q7jm2VcPyWXsk3zMag5t1h91Mv4ge7SM45iDUtM52o

# hash password and set GRAYLOG_ROOT_PASSWORD_SHA2
echo -n admin | shasum -a 256
8c6976e5b5410415bde908bd4dee15dfb167a9c873fc4bb8a81f6f2ab448a918  -
To start Graylog, use the command docker-compose up. Graylog will display an initialization
password, which you will need to complete the setup. Navigate to http://localhost:9000 to finish the setup process.
docker-compose up

...
graylog-1   |                                                              ---
graylog-1   |                                                              ---
graylog-1   |                                                              ---
graylog-1   |     ########  ###   ######### ##########   ####         #### ---         .----               ----
graylog-1   |   ###############   ###################### #####       ####  ---      ------------       .----------- --
graylog-1   |  #####     ######   #####              #### ####      ####   ---     ---        ---     ---        -----
graylog-1   | ####         ####   ####       ############  ####     ####   ---    --           ---   ---           ---
graylog-1   | ###           ###   ####     ##############   ####   ####    ---   ---            --   --             --
graylog-1   | ####         ####   ####    ####       ####    #### ####     ---   ---            --   --            .--
graylog-1   | #####       #####   ####    ####       ####     #######      ---    ---          ---   ---           ---
graylog-1   |  ################   ####     ##############     ######-       --     ----      ----      ---       -----
graylog-1   |    ##############   ####      #############      #####        -----   -----------         ----------  --
graylog-1   |              ####                                ####                                                ---
graylog-1   | #####       ####                                ####                                     -          .--
graylog-1   |   #############                                ####                                     -----     ----
graylog-1   |      ######                                   ####                                          -------
graylog-1   |
graylog-1   | ========================================================================================================
graylog-1   |
graylog-1   | It seems you are starting Graylog for the first time. To set up a fresh install, a setup interface has
graylog-1   | been started. You must log in to it to perform the initial configuration and continue.
graylog-1   |
graylog-1   | Initial configuration is accessible at 0.0.0.0:9000, with username 'admin' and password 'uLBTkkPAYM'.
graylog-1   | Try clicking on http://admin:uLBTkkPAYM@0.0.0.0:9000
graylog-1   |
graylog-1   | ========================================================================================================
graylog-1   |
...
To complete the setup, follow these steps:
- Initialize the Graylog CA by clicking on
Create CA. - Next, click on
Create policy. - Then, click on
Provision certificate and continue. - Finally, click on
Resume startup.
You can now log in with the username admin and the password you used during setup (in this example, admin).
Prepare graylog to receive logs#
GELF (Graylog Extended Log Format) is the ideal log format for Docker to Graylog integration because it is specifically designed to handle structured log data efficiently. GELF supports large, structured JSON messages that include various metadata, making it easy to analyze and search logs in Graylog. It also handles chunked messages, ensuring that even large logs are transmitted without data loss. Additionally, GELF’s built-in compression reduces bandwidth usage and its ability to include custom fields enhances flexibility in log management.
- Goto
Systems > Input, selectGELF UDP - Click
Launch new input - Enter a title like
GELF input, leave all other settings default - Click
Launch input
Now Graylog is ready to receive logs from Docker.
Logging Docker to Graylog#
By default, containers log to stdout. You can redirect stdout to Graylog. Most applications already log in JSON format to stdout. If your application does not, check if there is an option to enable JSON logging. JSON logs can be automatically parsed, eliminating the need for GROK patterns or regex to process them efficiently.
To enable the log forwarding of a container modify your docker-compose.yaml file and add logging sections
to your config.
logging:
      driver: "gelf"
      options:
        gelf-address: "udp://10.62.4.48:12201"
Here a complete example from my lab vault docker container:
services:
  vault:
    image: hashicorp/vault
    container_name: prodvault
    environment:
      VAULT_ADDR: http://127.0.0.1:8200
    ports:
      - "8200:8200"
    volumes:
      - private-volume:/vault/file:rw
      - ./vault:/vault/config:rw
    cap_add:
      - IPC_LOCK
    entrypoint: vault server -config=/vault/config/vault.json
    logging:
      driver: "gelf"
      options:
        gelf-address: "udp://10.62.4.48:12201"

  unsealer:
    image: alpine:3.9.2
    command: sh -c "apk add curl jq  && chmod +x /root/unseal.sh && /root/unseal.sh"
    volumes:
      - ./vault/unseal.sh:/root/unseal.sh:rw
    depends_on:
      - vault


volumes:
  private-volume:
After restart my vault instance I enabled in the shell of the container audit logging to stdout.
docker exec -it prodvault sh

vault login hvs.k7PX5CHsJacAkg5MscvQpgZJ
Success! You are now authenticated. The token information displayed below
is already stored in the token helper. You do NOT need to run "vault login"
again. Future Vault requests will automatically use this token.

Key                  Value
---                  -----
token                hvs.k7PX5CHsJacAkg5MscvQpgZJ
token_accessor       l5uWvUbI1ymChQxbUVuzEOc3
token_duration       ∞
token_renewable      false
token_policies       ["root"]
identity_policies    []
policies             ["root"]

# Execute logging to stdout
vault audit enable file file_path=stdout

# Exit
exit
Now, if you use Vault, you will see the initial logs in Graylog.
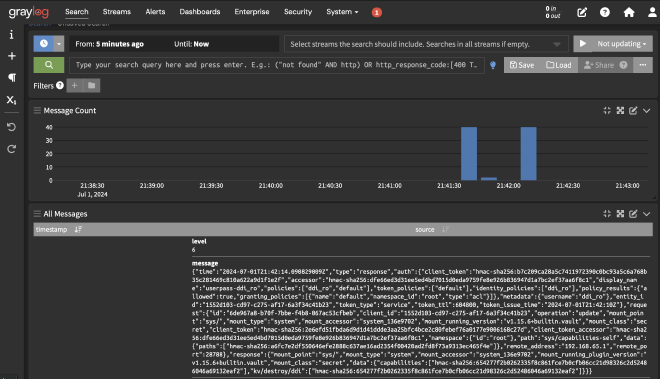
However, the message contains the complete JSON and is not interpreted by Graylog. To fix this, you need an input parser.
- Go to
Systems > Inputsand clickManage extractorson your created GELF input. - Create a new extractor and select
Load message. - Now, go to the message field:
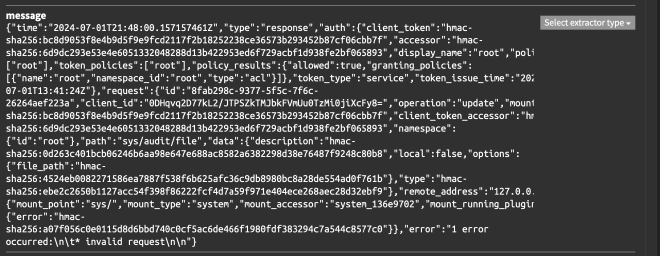
- Select
Select extractor typeand chooseJSON. - You can leave the default settings and click
Try. The JSON should be shown as a parsed key-value dictionary. - Define a title, such as
JSON Extractor, and clickCreate extractor.
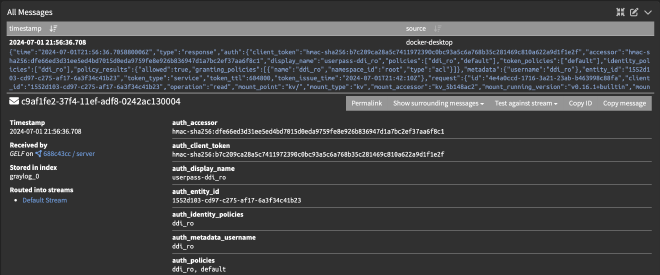
Now, if you look at the newly arrived logs, you will see that the JSON is extracted and parsed. You can now filter on all fields.
Flask JSON logging (container app)#
You can easily use uwsgi with Flask to log in JSON format.
Install uwsgi with pip:
pip install uwsgi
Modify the uwsgi.ini to log in JSON format:
[uwsgi]
module = app:app
http = :5005
log-format = {"time":"%(ftime)","status":"%(status)","method":"%(method)","uri":"%(uri)","protocol":"%(proto)","size":"%(size)","host":"%(host)","user-agent":"%(uagent)","referer":"%(referer)"}
If you are running the Flask app together with uwsgi in a Docker container, you can redirect the logs using the same method described for Docker above.
{"time":"01/Jul/2024:18:55:36 +0200","status":"200","method":"GET","uri":"/","protocol":"HTTP/1.1","size":"92","host":"localhost:5005","user-agent":"Mozilla/5.0 (Macintosh; Intel Mac OS X 10_15_7) AppleWebKit/605.1.15 (KHTML, like Gecko) Version/17.5 Safari/605.1.15","referer":"-"}
To enable in Flask logging in JSON format you can do this together with python-json-logger package.
from flask import Flask, request
import logging
from pythonjsonlogger import jsonlogger
from datetime import datetime

class CustomJsonFormatter(jsonlogger.JsonFormatter):
    def add_fields(self, log_record, record, message_dict):
        super(CustomJsonFormatter, self).add_fields(log_record, record, message_dict)
        log_record['time'] = datetime.now().strftime('%d/%b/%Y:%H:%M:%S %z')
        log_record['host'] = request.remote_addr if request else 'N/A'

app = Flask(__name__)

logHandler = logging.StreamHandler()
formatter = CustomJsonFormatter('%(time)s %(host)s %(message)s')
logHandler.setFormatter(formatter)
app.logger.addHandler(logHandler)
app.logger.setLevel(logging.INFO)

@app.route('/')
def hello():
    app.logger.info('Hello endpoint was reached', extra={'request_method': request.method})
    return 'Hello, World!'

if __name__ == '__main__':
    app.run()
Logging with Loguru and pygelf#
You can enhance your logging by combining my favorite logging library,
loguru with pygelf to seamlessly send logs to Graylog.
pip install loguru pygelf
Example code:
from loguru import logger
from pygelf import GelfUdpHandler

handler = GelfUdpHandler(
        host="10.62.4.48",
        port=12201)

logger.add(handler, serialize=True)

# Log some messages
logger.info("This is an info message")
logger.warning("This is a warning message")
logger.error("This is an error message")
Conclusion#
Logging is a vital part of managing and maintaining applications, especially in a containerized environment. By using JSON formatted logs and integrating with Graylog, you can ensure your logs are structured, searchable, and easily accessible. By following these practices, you can enhance your application’s observability and streamline your operations.
From an audit and security perspective, comprehensive logging is essential for monitoring, compliance, forensics, and accountability. Implementing robust logging mechanisms helps safeguard your applications and data, ensuring that you can respond swiftly and effectively to any incidents that arise.
Happy automating, happy logging! 😊